Presidential election years typically involve uncertainty, but should investors expect more or less than average equity market volatility in election years? While there is a strong connection between uncertainty and market volatility, an analysis of election year volatility reveals the historical pattern is counterintuitive.
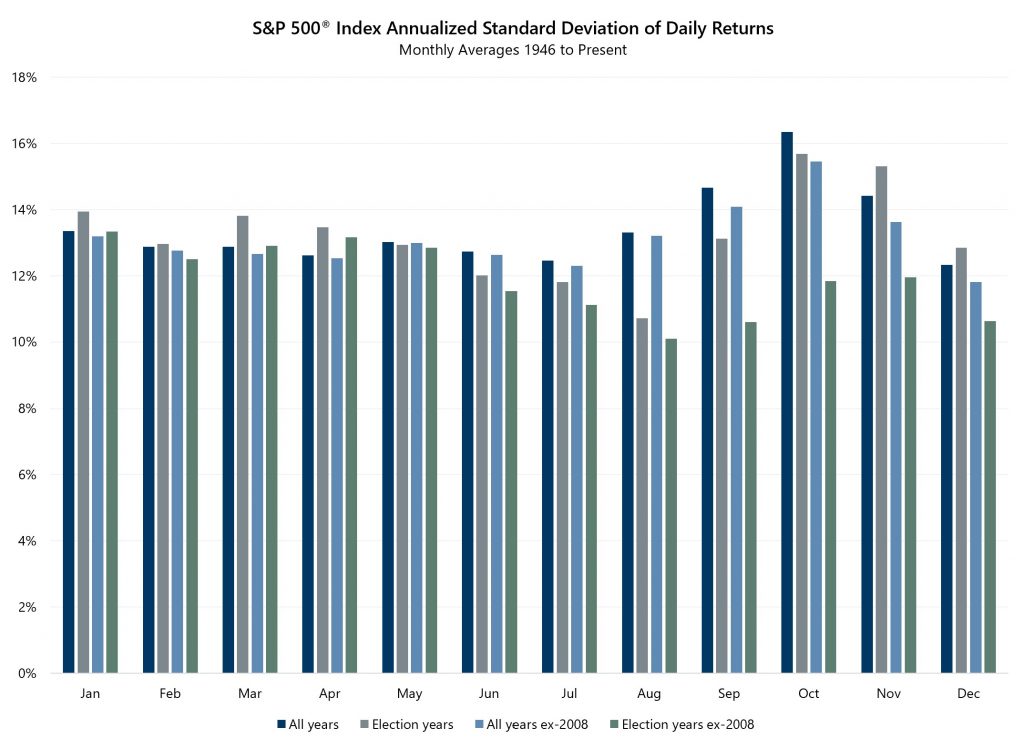
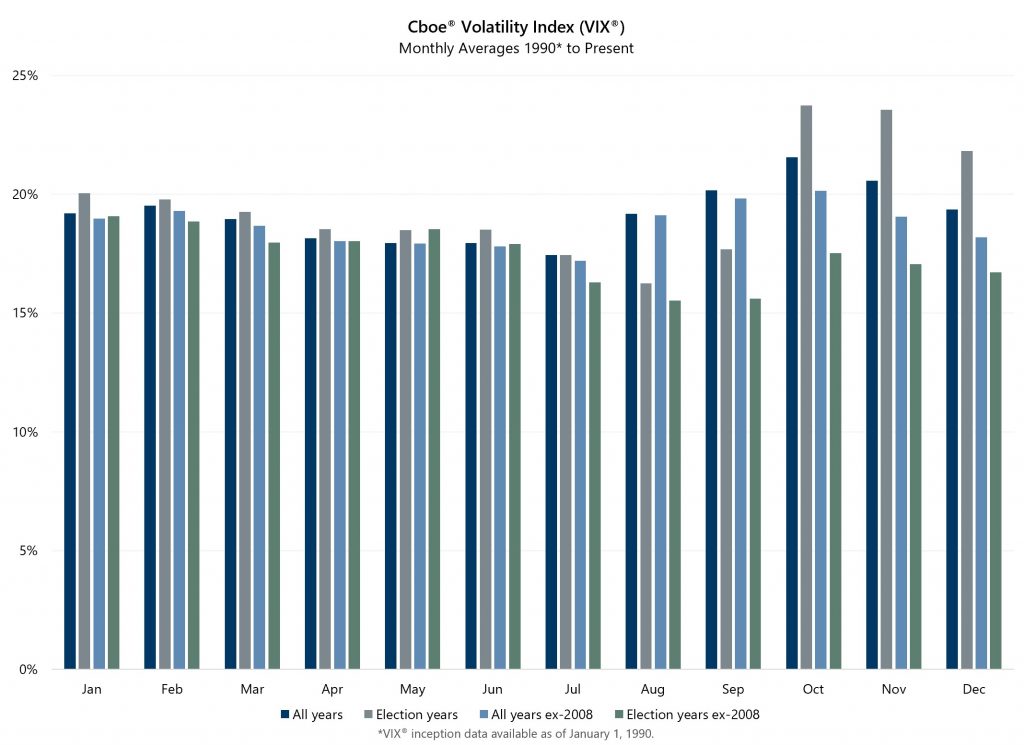
Election years typically have lower volatility levels relative to non-election years. The relationship is especially noticeable when 2008 is removed from the dataset. Although 2008 was both an election year and highly volatile, the great financial crisis was undeniably the main driver of volatility rather than political dynamics.
Investors may expect volatility levels to increase as a presidential election draws near. However, volatility levels are particularly low over the second half of the election years. Volatility has tended to decline in the summer months and rise in the fall, as the November election approaches, but remain below average volatility levels of non-election years. This pattern holds across both realized volatility, as measured by the standard deviation of daily returns, and the implied volatility levels reflected in the index options market, as measured by the Cboe® Volatility Index (the VIX®).


Source: Bloomberg, L.P.
Will the historical pattern play out in 2020? So far, this year has provided a strong dose of uncertainty related to the spread of the COVID-19 illness. The presidential election process will also contribute its fair share of uncertainty as the year progresses.
2008 is a dramatic illustration of the phenomenon that the source of severe volatility is rarely connected to politics. In 2020, investors will have to wait-and-see what ultimately drives volatility and if this election year will be different.


