Certain Uncertainty
In recent Perspectives, stock market volatility trends and impact on options market pricing has been reviewed. Summertime Volatility highlighted the seasonality of implied and realized volatility – showing that, on average, levels are lower during the summer months of June, July, and August compared to the remainder of the year. Given the U.S. presidential election on the horizon in 2024, along with numerous other potential drivers of volatility, investors may now want to consider options-based strategies which can benefit from an increase in volatility.
When considering presidential election year volatility, it was found that, since 1990, both realized and implied volatility were higher compared to non-presidential election years. What was interesting to note in Avoid Distraction was that there were numerous factors driving volatility during these political showdown years – some of which easily eclipsed any importance of the nameplate swap at the Oval Office. For instance, the 2000, 2008, and 2020 presidential elections likely took a back seat to the bursting of the “Dot-Com Bubble,” a global financial crisis, and a worldwide pandemic, respectively. Whether the election is truly impactful to volatility or not, summer is quickly melting away and uncertainty around this most certain event is beginning to build.
Vote for Volatility
The Cboe® Volatility Index (the VIX®) futures curve provides an estimate of future implied volatility and is typically upward sloping, suggesting higher levels of volatility and stock market return dispersion as you look further into the future. Only in times of market turbulence, such as the Great Financial Crisis, the 2018 “Volmageddon” episode, or the recent pandemic, does the curve invert – suggesting short-term volatility is higher than long-term.
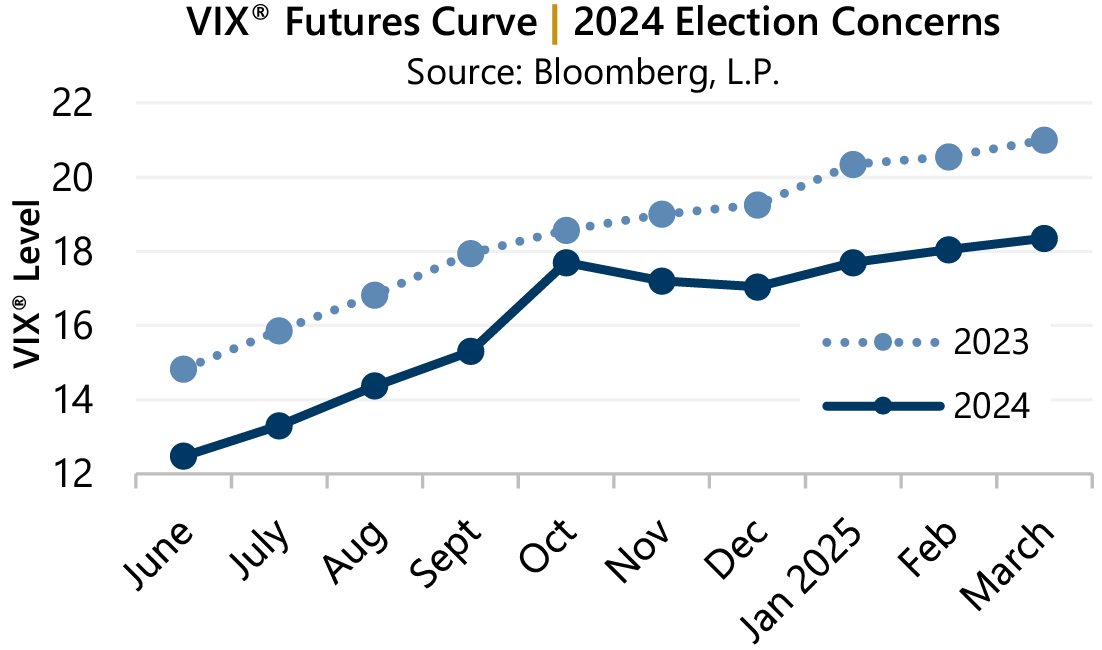 At the start of the third quarter, the futures curve for the VIX® suggests levels may increase significantly in October, sharply higher than the prior month of September and the following months of November and December.
Consider the current regression line where the slope suggests an average increase in implied volatility of approximately 1.32 points per month. However, October’s jump was 2.40 points over September, nearly twice as much as the average increase, and the upward slope in volatility does not resume for three months post-election. Compare this to the average slope of the VIX® futures curve from one year ago, which was slightly higher at an average of 1.45 points per month but showed no jump higher in October – typical of a nonelection year.
Exceptional Candidates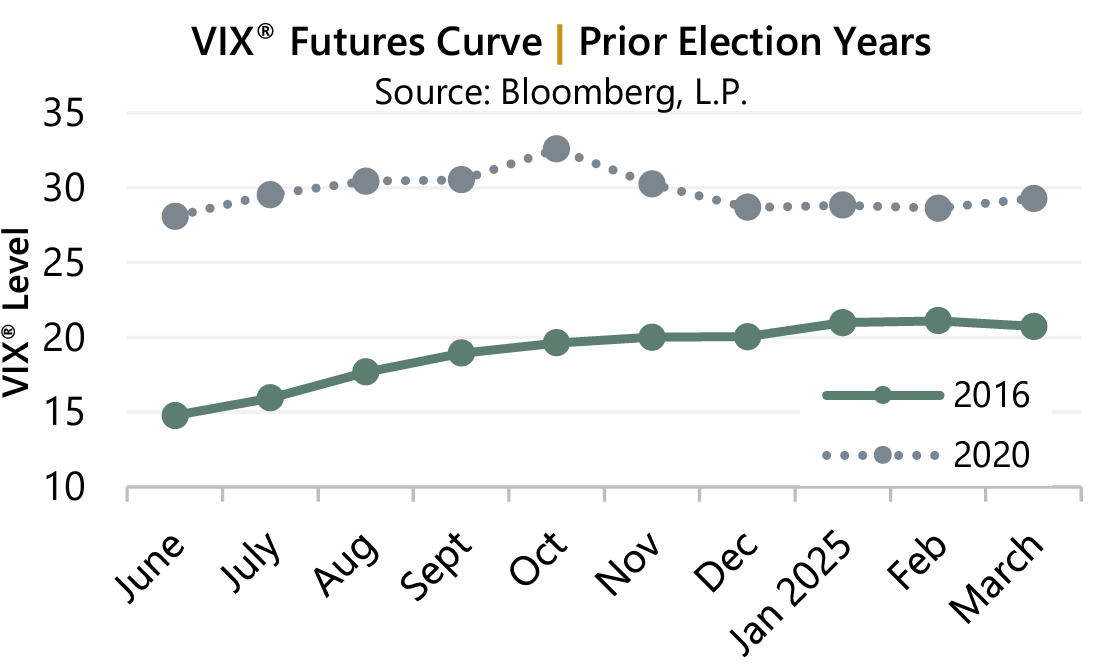 As often reminded, past performance is not indicative of future results and every election year is different. Dialing back to the same time in recent election years shows divergent stories.
2020 was exceptional and the declaration of a pandemic shifted volatility higher for the year, leading to a slightly negative sloping VIX® futures curve. However, the election bump remained in October.
In 2016, the VIX® curve was positively sloping – as is typical in the absence of significant volatility events. However, there was a complete absence of a bump in volatility preceding the election just four months prior to the event.
Avoid Distraction
Regardless of the election outcome, lurking drivers of volatility, or the shape of its futures curve, investors should remain vigilant to the unexpected. Since 1977, Gateway has focused on stability, risk-adjusted performance and long-term growth, and generating cash flow through the use of options. The firm’s index option-based strategies have consistent risk profiles and are uniquely positioned to benefit from the current market environment of interest rates away from zero, a robust volatility risk premium, and implied volatility persistently in the double-digits.