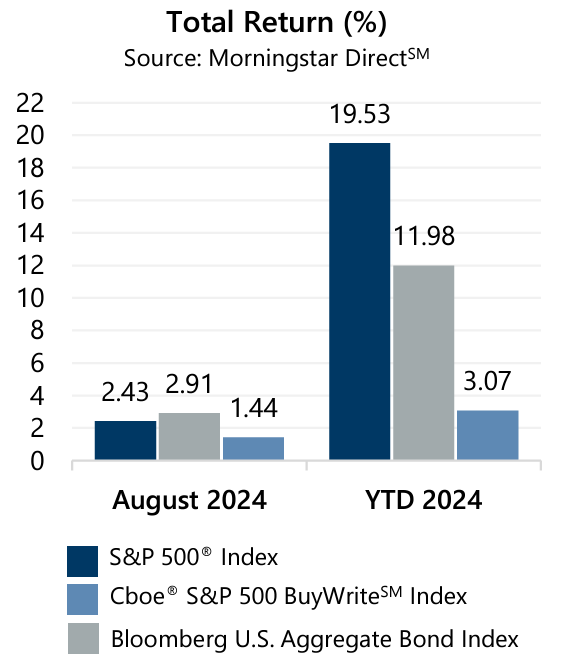
 The S&P 500® Index returned 2.43% during August. As if a dream, or nightmare, August’s unexpected equity market decline drove volatility to crisis-era levels and led to the largest drawdown in 2024. The cause? A relatively weak jobs report paired with the unwinding of a carry trade in Japan… Suddenly, domestic recession fears were resurrected and concerns of the U.S. Federal Reserve (the Fed) being behind the curve, amongst divergent global monetary policy, was on investor’s minds. From its recent high on July 16 through August 5, the S&P 500® Index declined -8.45%, which included a decline of -6.07% in the brief period from the end of July through August 5. By the end of the month, calm had been restored and the equity market had recovered its losses as the Fed revised messaging towards labor market support while acknowledging progress, if not success, in its efforts to tame inflation*. From August 5 through month-end, the S&P 500® Index climbed 9.05%. From the start of 2024 through August 30, the S&P 500® Index has climbed 19.53%.
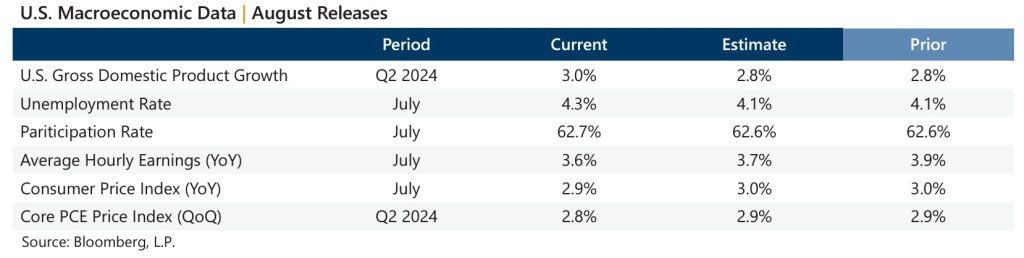
Data released in August showed a resilient economy, a slightly soft labor market, and continued progress on inflation which seems to have given the Fed what it needs to cut rates at their September meeting. The second estimate of Gross Domestic Product for the second quarter of 2024 beat the consensus estimate and exceeded the prior quarter figure. The year-over-year July Consumer Price Index, released August 14, was below the previous reading and consensus estimates. The quarter-over-quarter Personal Consumption Expenditures (PCE) Price Index also showed a decline from the prior period and was below the consensus expectation. Corporate earnings remained positive, with second quarter aggregate operating earnings on track to climb 1.8% quarter-over-quarter and 5.4% year-over-year. With nearly 93% of S&P 500® Index companies reporting, almost 84% have met or exceeded analyst estimates.
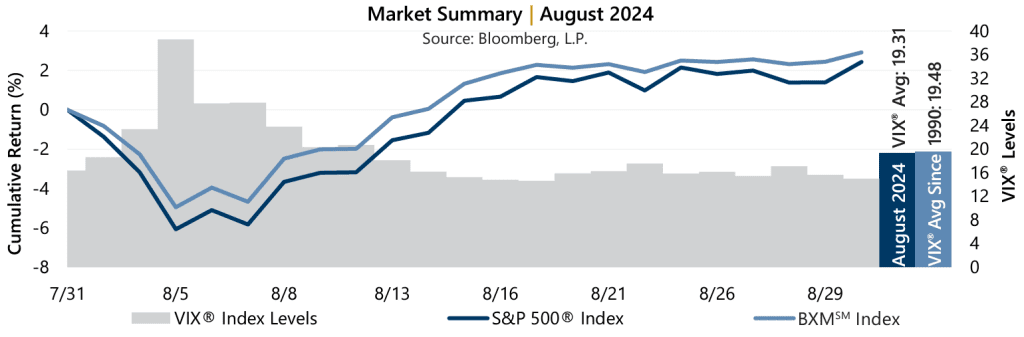
 The Cboe® S&P 500 BuyWriteSM Index1 (the BXMSM) returned 2.91% in August, bringing its year-to-date return to 11.98%. The premiums the BXMSM collected as a percentage of its underlying value provided loss mitigation and are an important component of performance. During the market’s drawdown from July 16 to August 5, the BXMSM returned -5.07% compared to the S&P 500® Index decline of -8.45%. The passive approach of the BXMSM resulted in relatively low market exposure when entering August, which shifted higher as the market declined before being reset when the BXMSM wrote its new index call option with a September expiration on August 16. From the close of July to August 16, the BXMSM returned 1.85% while the S&P 500® Index climbed 0.67%. The BXMSM collected a premium of 1.94% when writing its new index option on August 16, which supported its 1.05% return from August 16 through month-end. The S&P 500® Index returned 1.75% during this period.
The Bloomberg U.S. Aggregate Bond Index returned 1.44% in August, bringing its year-to-date return to 3.07%. The yield on the 10-year U.S. Treasury Note (the 10-year) ended July at 4.03% and closed at its intra-month low of 3.79% in early August before climbing to an intra-month high of 3.99% on August 8. The 10-year closed August at 3.90%. In a historical inversion that has persisted since July 5, 2022, the yield on the 2-year U.S. Treasury Note exceeded that of the 10-year for the month.