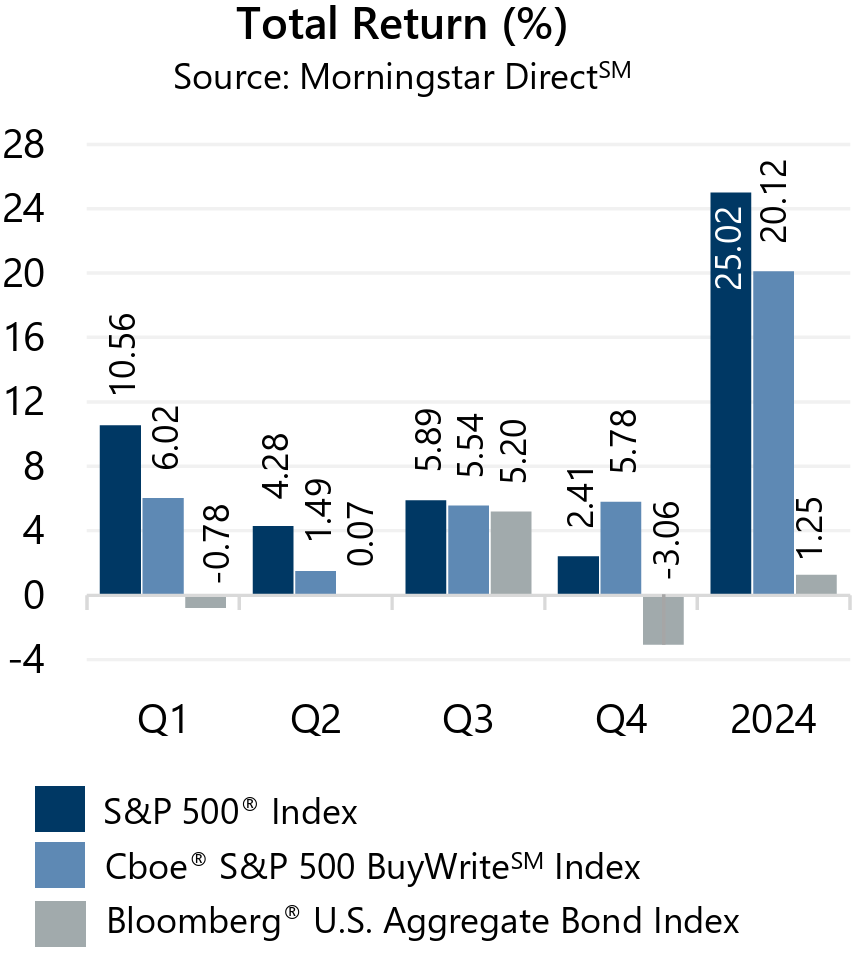
 The S&P 500® Index returned 2.41% in the fourth quarter of 2024, with monthly returns of -0.91%, 5.87%, and -2.38% in October, November, and December, respectively. The removal of uncertainty surrounding the U.S. presidential election led to siginificant equity market gains in November which overwhelmed pre-election uncertainty in October and negative sentiment in December following comments from the U.S. Federal Reserve (the Fed) suggesting caution with future interest rate cuts. The quarterly advance brought the full-year 2024 S&P 500® Index’s return to 25.02%, which marked the first time the market has had consecutive calendar year returns above 20% since 1998 and 1999. Those years were part of a five year streak of 20%+ annual returns that contributed to the Tech Bubble which burst over the early 2000s.
Data released in December revealed a domestic economy with steady inflation and a stable labor market. The final estimate of Gross Domestic Product for the third quarter of 2024 was better than the consensus estimates and higher than the prior figure. The year-over-year November Consumer Price Index released December 11 matched consensus estimates and was slightly higher than the prior period. The quarter-over-quarter Personal Consumption Expenditures (PCE) Price Index, a Fed favorite, ticked higher than the prior period and the consensus estimates. Corporate earnings were positive in the third quarter with aggregate operating earnings on track to climb 3.2% quarter-over-quarter and 7.6% year-over-year. With more than 99% of S&P 500® Index companies reporting, over 79% have met or exceeded analyst estimates.

 The S&P 500® Index returned 10.56%, 4.28%, 5.89%, and 2.41% in the first, second, third, and fourth quarters of 2024, respectively. The Fed, monetary policy, and the U.S. presidential election dominated headlines and significantly contributed to equity market returns – and volatility – during 2024. After a strong 2023 and signs of normalizing rates of inflation, the market continued its advance in 2024 as the Fed pivoted from hike-and-hold to cautious cutting, delivering multiple interest rate reductions. Investors endured plenty of volatility throughout the year, however. Most notably, 2024’s maximum drawdown surprised investors during the summer as a peculiar and unexpected response to a weak-but-routine domestic jobs report and the unwinding of a popular foreign currency trade. U.S. presidential election uncertainty was removed decisively on election night and investors quickly turned their focus to potential policy implications from President Trump’s return to the White House and their potential impact on the economy.
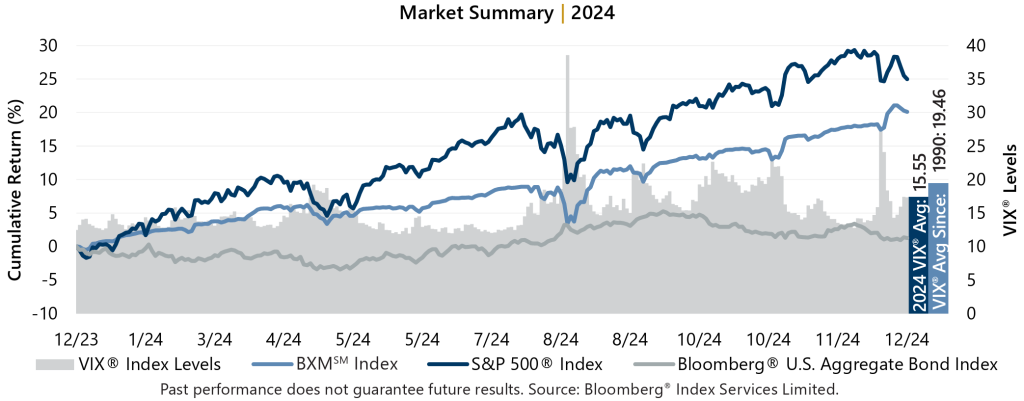
The spread between S&P 500® Index implied and realized volatility, or the Volatility Risk Premium, remained robust during the fourth quarter and full year 2024. Implied volatility, as measured by the Cboe® Volatility Index (the VIX®), averaged 17.36 and 15.55 for the fourth quarter and full year, respectively. Realized volatility, as measured by the standard deviation of daily returns for the S&P 500® Index, was 12.58% for the fourth quarter and 12.66% for the year.
Outside of a brief bout of volatility in April 2024, the VIX® was relatively subdued in the first half of 2024 and reached lows not seen since pre-COVID as investors patiently waited for a shift in monetary policy. The VIX® reached a 2024 low of 11.86 on May 21. As the U.S. presidential election took an unexpected turn in July, the S&P 500® Index navigated its largest drawdown of the year, and the VIX® shifted higher, reaching an intra-year closing high of 38.57 on August 5 and remained robust through year-end. From January 1 through June 30, the VIX® averaged 13.85 compared to its average of 17.21 from July 1 through year-end.

 The Cboe® S&P 500 BuyWriteSM Index1 (the BXMSM) returned 5.78% in the fourth quarter, bringing its full year return to 20.12%. The premiums the BXMSM collect as a percentage of its underlying value provided loss mitigation and are an important component of performance. The BXMSM returned -0.50%, 4.00% and 2.22% in October, November, and December, respectively. The premiums the BXMSM collected as a percentage of the BXM’sSM underlying value were 1.84%, 1.75%, and 2.42% in October, November, and December, respectively. The rules-based timing of the BXMSM’s option writing and the level of premiums collected as a percentage of its underlying value provided significant loss mitigation during periods of market decline and contributed to the BXMSM’s outperformance of the S&P 500® Index during the quarter.
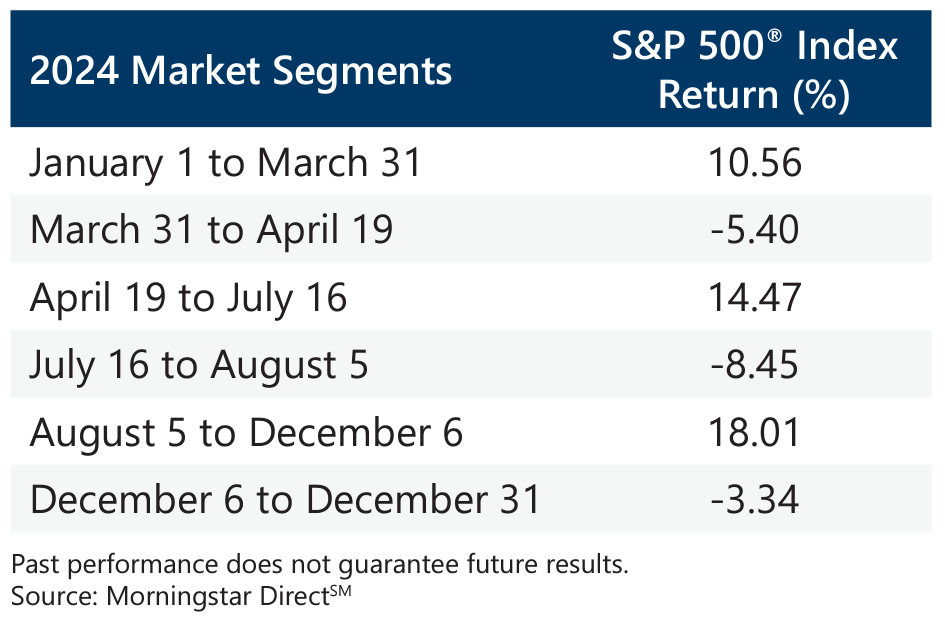
The performance of the BXMSM exhibits both the importance of cash flow generation and effects of a passive approach to index call option writing. During periods of market stress in 2024, premiums collected reflected heightened levels of volatility and provided a source of downside protection. For instance, the BXMSM provided 289 basis points (bps) of loss mitigation with a return of -2.51% during the S&P 500® Index decline of -5.40% from March 31 to April 19. Similarly, during the -8.45% decline of the S&P 500® Index from July 16 to August 5, the BXMSM provided 338 bps of downside protection with a return of -5.07%. However, the passive approach of the BXMSM resulted in varying and unpredictable levels of market exposure which can greatly impact participation. For instance, as the equity market advanced 14.47% from April 19 to July 16, the BXMSM captured less than half of the return with an advance of just 5.40%. In contrast, during the equity market’s 18.01% advance from August 5 through December 6, the BXMSM captured a majority of the advance with a return of 14.12%.
The Bloomberg® U.S. Aggregate Bond Index (the Agg) returned -3.06% in the fourth quarter of 2024, resulting in a return of 1.25% for the year. The Agg returned -0.78%, 0.07%, and 5.20% in the first, second, and third quarters of 2024, respectively. The gain in 2024 was propelled by rate declines experienced from April to September, which were the result of the Fed’s interest rate cutting efforts. The yield on the 10-year U.S. Treasury Note (the 10-year) ended 2023 at 3.88% and reached a 2024 high of 4.70% on April 25. As the Fed delivered on rate cuts, the yield on the 10-year dipped down to an intra-year low of 3.62% on September 16 before reversing course to end the year at 4.57%.
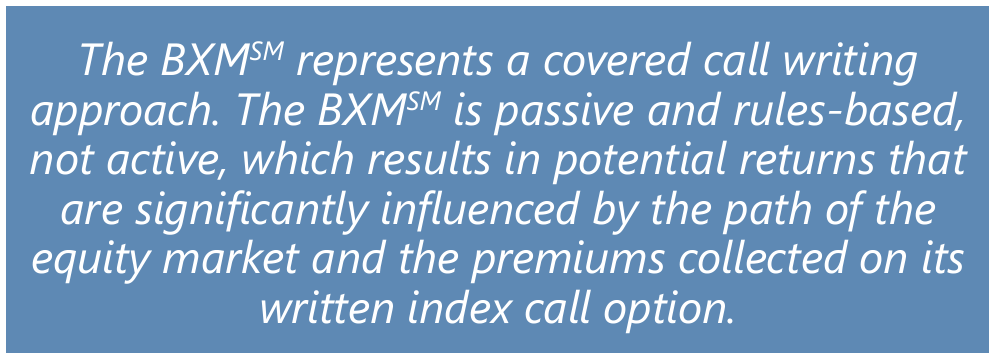
1The BXMSM is a passive total return index designed to track the performance of a hypothetical buy-write strategy on the S&P 500® Index. The construction methodology of the index includes buying an equity portfolio replicating the holdings of the S&P 500® Index and selling a single one-month S&P 500® Index call option with a strike price approximately at-the-money each month on the third Friday of the standard index-option expiration cycle and holding that position until the next expiration.
Past performance does not guarantee future results. Sources: Morningstar DirectSM.
Bloomberg Index Services Limited. BLOOMBERG® and the indices referenced herein (the “Indices”, and each such index, an “Index”) are service marks of Bloomberg Finance L.P. and its affiliates (collectively “Bloomberg”) and/or one or more third-party providers (each such provider, a “Third-Party Provider,”) and have been licensed for use for certain purposes to GATEWAY INVESTMENT ADVISERS, LLC (the “Licensee”). To the extent a Third-Party Provider contributes intellectual property in connection with the Index, such third-party products, company names and logos are trademarks or service marks, and remain the property, of such Third-Pary Provider. Bloomberg or Bloomberg’s licensors own all proprietary rights in the Bloomberg Indices. Neither Bloomberg nor Bloomberg’s licensors, including a Third-Party Provider, approves or endorses this material, or guarantees the accuracy or completeness of any information herein or makes any warranty, express or implied, as to the results to be obtained therefrom and, to the maximum extent allowed by law, neither Bloomberg nor Bloomberg’s licensors, including Third-Party Provider, shall have any liability or responsibility for injury or damages arising in connection therewith.
For more information and access to additional insights from Gateway Investment Advisers, LLC, please visit www.gia.com.
