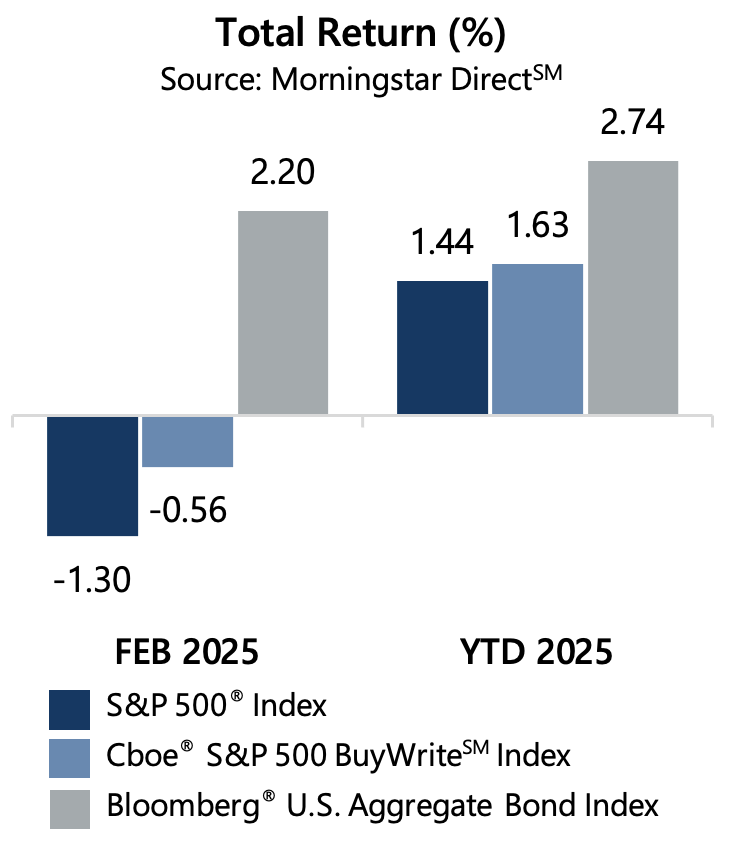
The S&P 500® Index declined -1.30% in February. From the beginning of 2025 to the end of February, the S&P 500® Index has returned 1.44%. It was a strong month for equity markets until headwinds overcame positive momentum in February, driven by softness in the tech sector, shifting global trade dynamics, and concerns of stagflation – slowing economic growth with persistent inflation. From the start of the month through February 19, the S&P 500® Index advanced 1.80% before declining -4.57% from February 19 to 27. The equity market rallied 1.60% on the last day of the month.
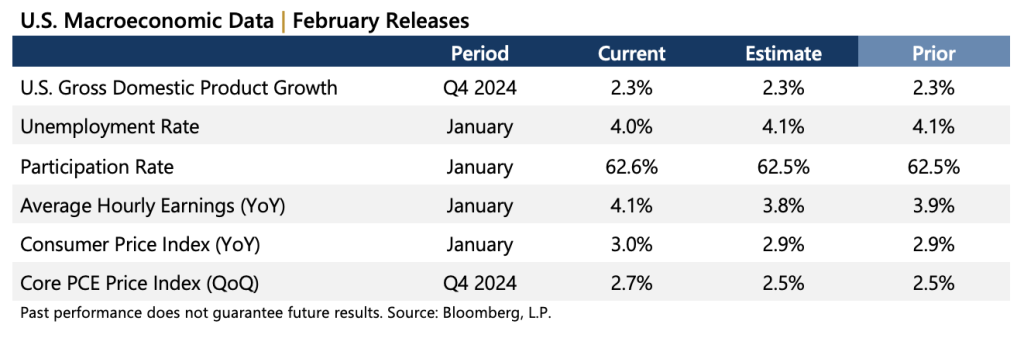
Data released in February revealed a stable economic backdrop with a seemingly strong labor force and persistent inflationary pressure. The second estimate of Gross Domestic Product for the fourth quarter of 2024 matched the consensus estimates and the prior figure. The year-over-year January Consumer Price Index released February 12 surpassed consensus estimates and was higher than the prior reading. It was the same story for the quarter-over-quarter Personal Consumption Expenditures (PCE) Price Index. With over 96% of S&P 500® Index companies reporting, corporate earnings are on track to be positive for the fourth quarter of 2024. Aggregate operating earnings climbed 3.4% quarter-over-quarter and 9.5% year-over-year. More than 80% of reporting companies have either met or exceeded analyst estimates.
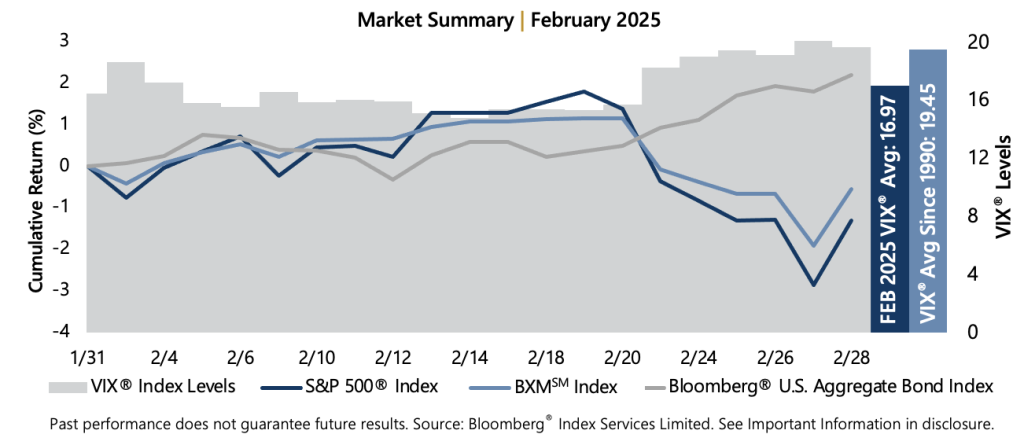
The Cboe® S&P 500 BuyWriteSM Index[1] (the BXMSM) returned -0.56% in February. The BXMSM has returned 1.63% since the start of 2025 to the end of February. The premiums the BXMSM collected as a percentage of its underlying value provided loss mitigation and are an important component of performance. The BXMSM wrote its new index call option with a March expiration on February 21 and collected a premium of 1.37%. During the market’s advance from the start of the month to February 19, the BXMSM returned 1.15% compared to the S&P 500® Index’s return of 1.80%. The passive approach of the BXMSM resulted in reduced market exposure as the market advanced, which proved beneficial during the intra-month equity market decline. The resetting of market exposure at its contract renewal on February 21, however, led the BXMSM to have increasing levels of equity market exposure through the decline that ended February 27. From February 19 to 27, option writing cash flow helped the BXMSM offset 155 basis points of loss with a return of -3.02% compared to the -4.57% return of the S&P 500® Index. The BXMSM advanced 1.38% compared to the S&P 500® Index advance of 1.60% on February 28.
The Bloomberg® U.S. Aggregate Bond Index returned 2.20% in February, advancing 2.74% since the start of 2025. The yield on the 10-year U.S. Treasury Note (the 10-year) ended January at 4.54% and reached its intra-month high of 4.62% on February 12 before ending February at an intra-month low of 4.21%. The U.S. Federal Reserve voted in January to hold rates steady and committed to monitoring incoming economic data in guiding their next steps.