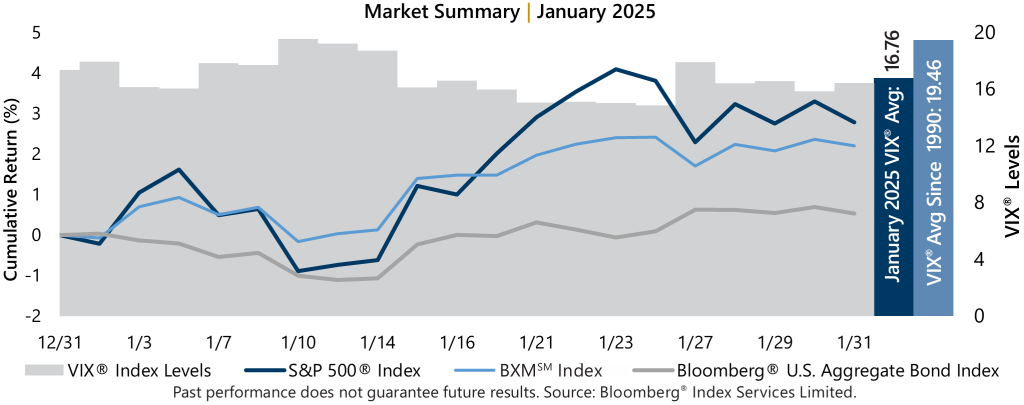
 It was a busy start to 2025 as investors digested the U.S. Federal Reserve’s (the Fed) decision to pause its recent string of interest rate cuts, drastic incoming changes to fiscal and trade policy, and the unexpected competition in the artificial intelligence (AI) race. The S&P 500® Index climbed 4.10% from the start of 2025 through January 23 before AI related news led to a decline of -1.26% from January 23 through month-end.
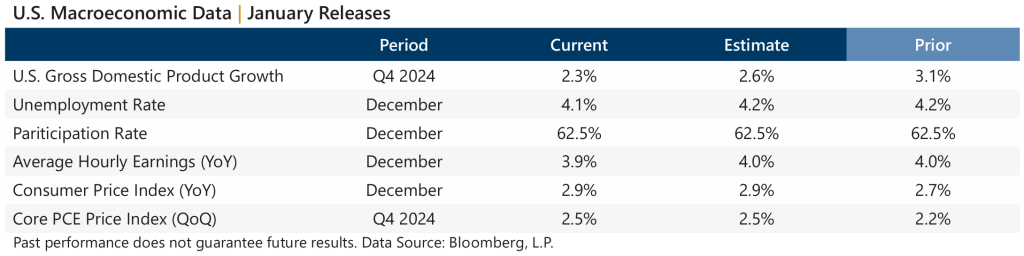
Data released in January revealed an economy in transition, with a slight uptick in inflation and stable labor market. The first estimate of Gross Domestic Product for the fourth quarter of 2024 fell below the consensus estimates and prior figure. The year-over-year December Consumer Price Index released January 15 matched consensus estimates but was higher than the prior. It was the same story for the quarter-over-quarter Personal Consumption Expenditures (PCE) Price Index, which matched the consensus estimates but exceed the prior reading. Corporate earnings were positive in the fourth quarter with aggregate operating earnings on track to climb 3.3% quarter-over-quarter and 9.4% year-over-year. With just over 35% of S&P 500® Index companies reporting, over 81% have met or exceeded analyst estimates.
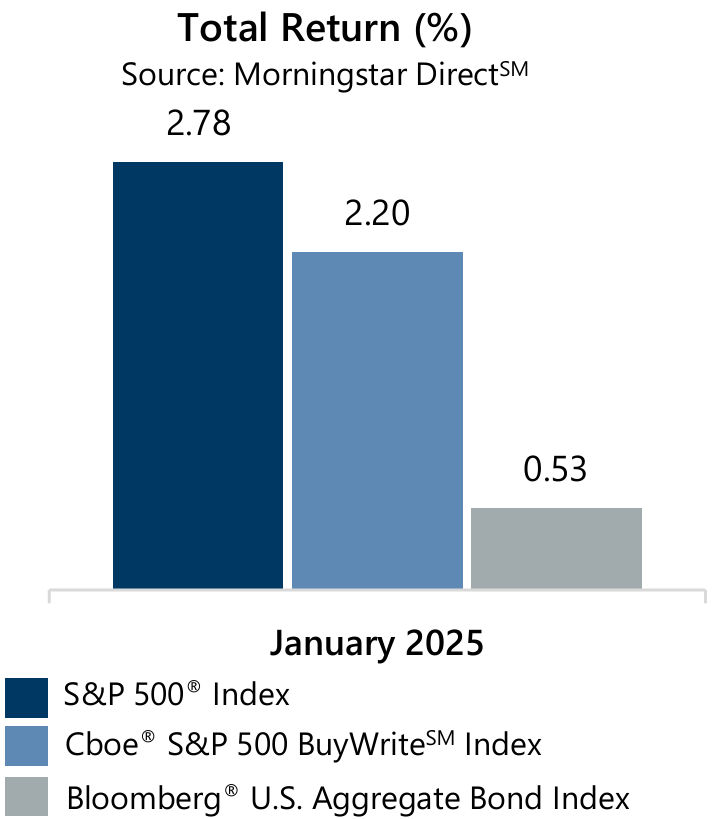
 The Cboe® S&P 500 BuyWriteSM Index1 (the BXMSM) returned 2.20% in January. The premiums the BXMSM collected as a percentage of its underlying value provided loss mitigation and are an important component of performance. The BXMSM wrote its new index call option with a February expiration on January 17 and collected a premium of 1.74%. During the market’s advance from the start of the year to January 23, the BXMSM returned 2.40% compared to the S&P 500® Index’s return of 4.10%. The passive approach of the BXMSM resulted in reduced market exposure as the market advanced, which proved beneficial during the brief decline during month-end. From January 23 to January 31, the BXMSM offset 106 basis points of the -1.26% decline in the S&P 500® Index with a return of -0.20%.
The Bloomberg U.S. Aggregate Bond® Index returned 0.53% in January. The yield on the 10-year U.S. Treasury Note (the 10-year) ended 2024 at 4.57% and reached its intra-month high of 4.79% on January 14 before falling to an intra-month low of 4.52% on January 30 and closing the month at 4.54%.