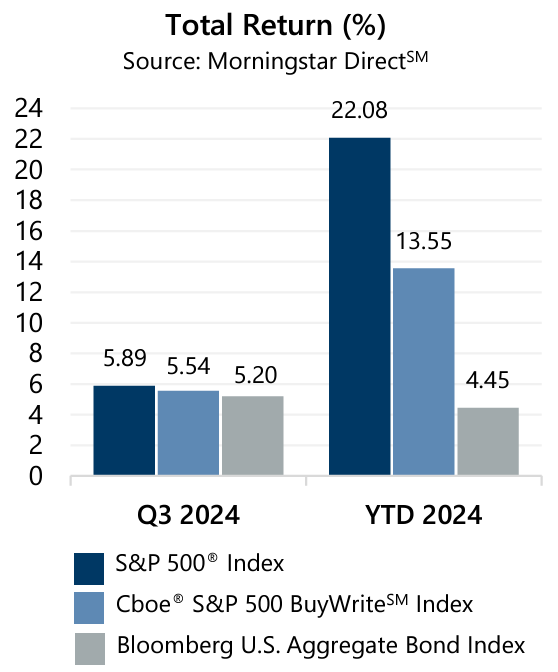
 The S&P 500® Index returned 5.89% in the third quarter with returns of 1.22%, 2.43%, and 2.14% in July, August, and September, respectively. In the third quarter investors navigated concerns surrounding tech sector earnings and diverging global monetary policy that delivered an unwinding of a popular carry trade involving the Japanese Yen. Most impactful, however, was the patience required in awaiting interest rate decisions from the U.S. Federal Reserve (the Fed).
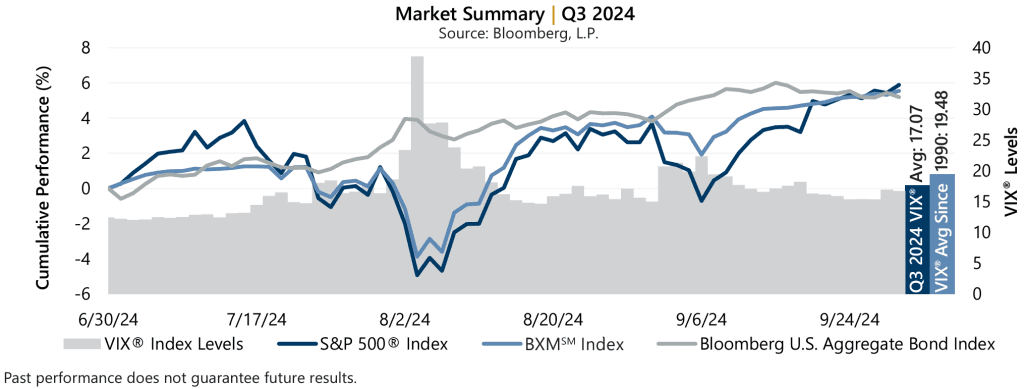
The S&P 500® Index climbed 3.84% from the start of the quarter to July 16 before encountering its maximum drawdown of -8.45% from July 16 to August 5. As investors reoriented and the likelihood of an interest rate cut climbed, the S&P 500® Index advanced 9.05% from August 5 to August 30. A weak reading on the labor market led to a decline of -4.22% for the S&P 500® Index from August 30 to September 6. The news was enough to support the case for the Fed to deliver its first interest rate cut since its recent tightening cycle began in 2022 and, from September 6 through quarter-end, the S&P 500® Index advanced 6.64%. From the start of 2024 through September 30, the equity market has climbed 22.08%.
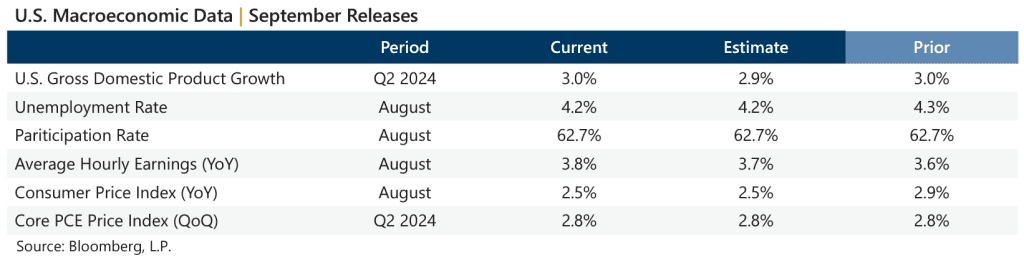
Data released in September suggested a steady macroeconomic backdrop and inflation trending in the right direction. The third estimate of Gross Domestic Product for the second quarter of 2024 outpaced the consensus estimate while the year-over-year August Consumer Price Index, released September 11, was slightly lower than the previous reading and matched consensus estimates. The quarter-over-quarter Personal Consumption Expenditures (PCE) Price Index, the Fed favorite, matched the prior reading and consensus expectations. Corporate earnings were positive with second quarter aggregate operating earnings climbing 1.6% quarter-over-quarter and 5.3% year-over-year. With now over 99% of S&P 500® Index companies reporting, nearly 84% met or exceeded analyst estimates.
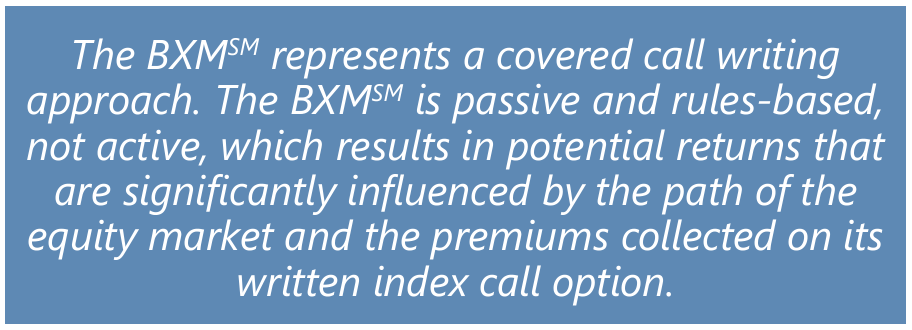 The Cboe® S&P 500 BuyWriteSM Index1 (the BXMSM) returned 5.54% during the third quarter, with returns of 1.13%, 2.91%, and 1.40% in July, August, and September, respectively. From the start of 2024 through quarter-end, the BXMSM has returned 13.55%. The premiums the BXMSM collected as a percentage of its underlying value provided downside loss mitigation. The BXMSM collected premiums of 1.53%, 1.94%, and 1.64% in July, August, and September, respectively.
As the equity market advanced in June and into July, the BXMSM’s market exposure declined until resetting higher on July 19 when the BXMSM wrote its new index call option with an August expiration. With a return of -5.07% during the S&P 500® Index’s maximum drawdown from July 16 to August 5, the premium that the BXMSM collected in July helped offset 338 bps of downside risk compared to the S&P 500® Index decline of -8.45%. From August 5 to quarter-end, the passive, rules-based approach of the BXMSM led to varying levels of market exposure. The premiums collected by the BXMSM in August and September provided loss mitigation and supported market participation during periods of advance. From August 5 to September 30, the BXMSM returned 9.80% relative to the 11.38% return of the S&P 500® Index.
The Bloomberg U.S. Aggregate Bond Index (the Agg) returned 5.20% in the third quarter with monthly returns of 2.34%, 1.44%, and 1.34% in July, August and September, respectively. Year-to-date through September 2024, the Agg has returned 4.45%. The yield on the 10-year U.S. Treasury Note (the 10-year) ended June at 4.40% and reached an intra-quarter high of 4.46% on July 1, before drifting to an intra-quarter low of 3.62 on September 16. The 10-year closed the quarter at 3.78%. The historical yield curve inversion that started July 5, 2022 ended during the quarter with the yield on the 2-year U.S. Treasury Note now lower than the yield of the 10-year. Yields on U.S. Treasury Bills (T-Bills), with maturities of one year or less, continued to exceed the yield on the 10-year. For example, the rate on the One-Year T-Bill ended the quarter at 4.00%.