Volatility in 2024
Investors following along this year witnessed higher average levels of volatility compared to the post-crisis quantitative easing era. However, until August, it was a relatively dull experience. Prior to the final month of summer, implied volatility – as measured by the Cboe® Volatility Index (the VIX®) – had only reached a high of 19.23 during April’s equity market drawdown.
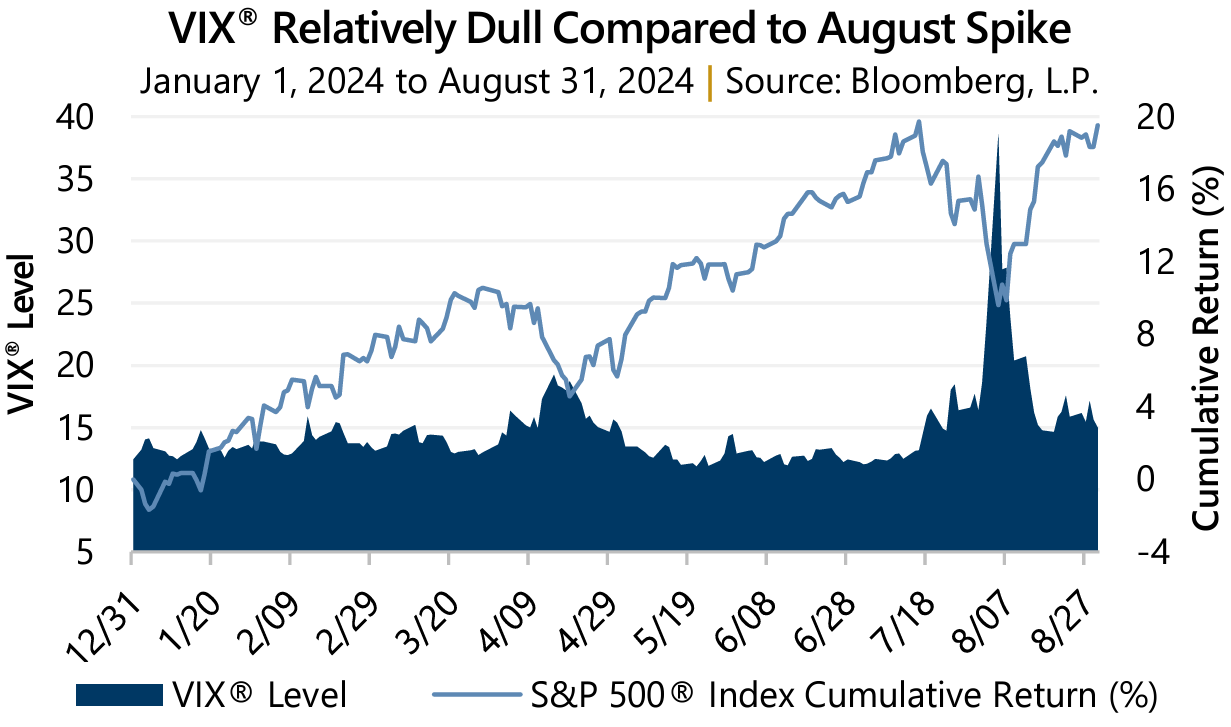 Expectations that the U.S. Federal Reserve (the Fed) would achieve the multiple expected interest rate cuts were dashed at the time given a resilient economy with stubborn inflation. Investors were able to accept there was plenty of year remaining and, in line with the typical summertime pattern, volatility drifted into a subdued range. Until things suddenly changed.
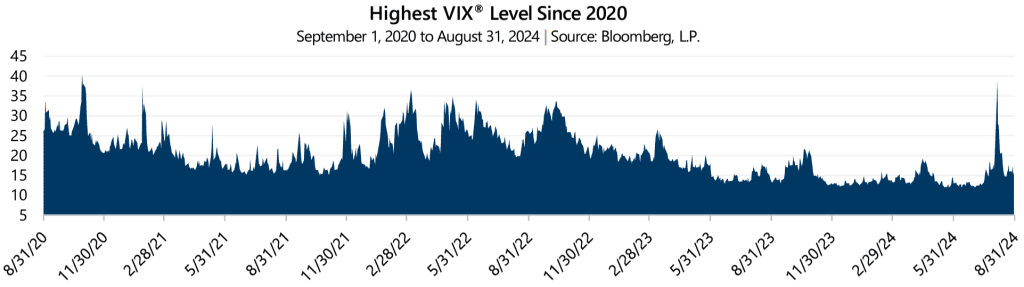
In early August the equity market was unexpectedly jolted with a new 2024 maximum drawdown and crisis-like volatility levels driven, in part, by concerns over possible recession, weak tech sector earnings, and liquidity concerns with the Japanese yen carry trade. The VIX®, which closed July at 16.36, jumped to close August 5 at 38.57 – a level not witnessed since October 2020. Summer vacation was over.
What’s Next?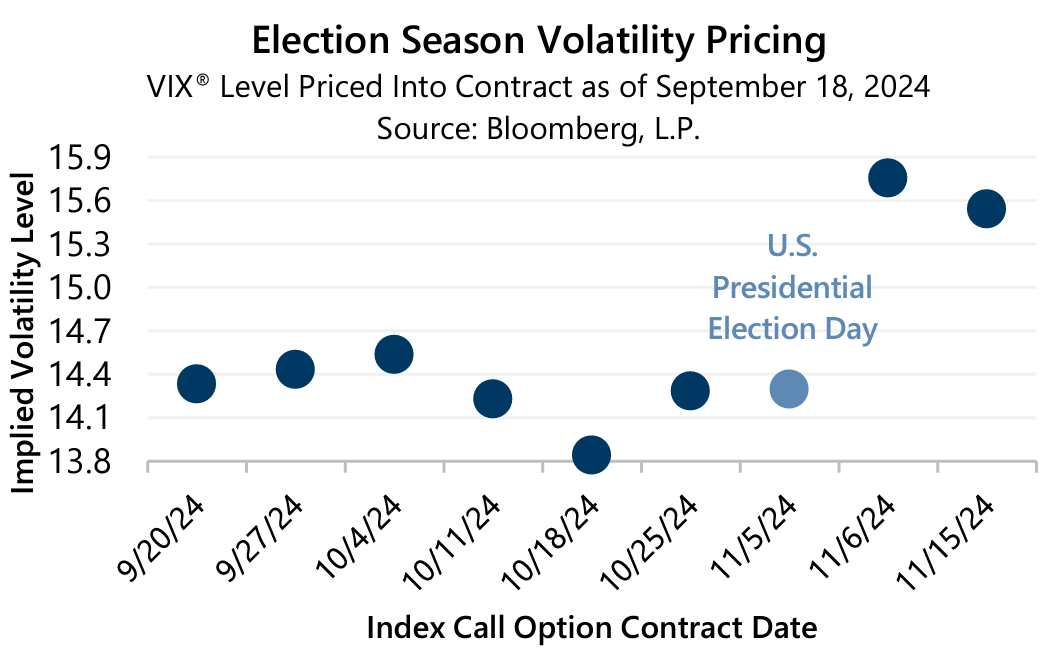 Gateway is not in the business of predictions but rather diligence and preparation for all environments. With armed conflicts waging in the middle east and Ukraine, growing global geopolitical uncertainty, and evolving monetary policy, the remainder of 2024 is stacked with known potential volatility events. For instance, The Election Episode explored the monthly VIX® futures curve which reflected heightened volatility surrounding the U.S. presidential election. Now, there are weekly S&P 500® Index option contracts listed until election day and beyond which suggests volatility is expected to shift higher the very day after the election.
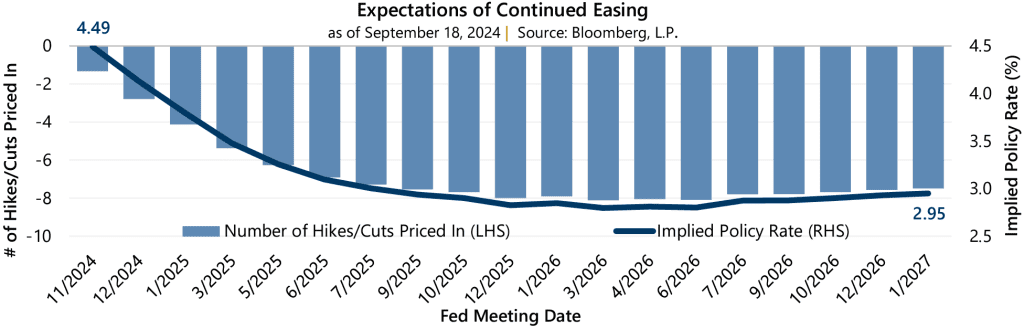
While uncertainty about conflict abroad or geopolitics could cause volatility to rise, expectations surrounding U.S. Fed Policy could be a larger force. With September’s larger-than-expected cut now behind us, there remains nearly 200 basis points of Fed Funds Rate reduction priced into the market through January 2027, with a low point in March 2026.
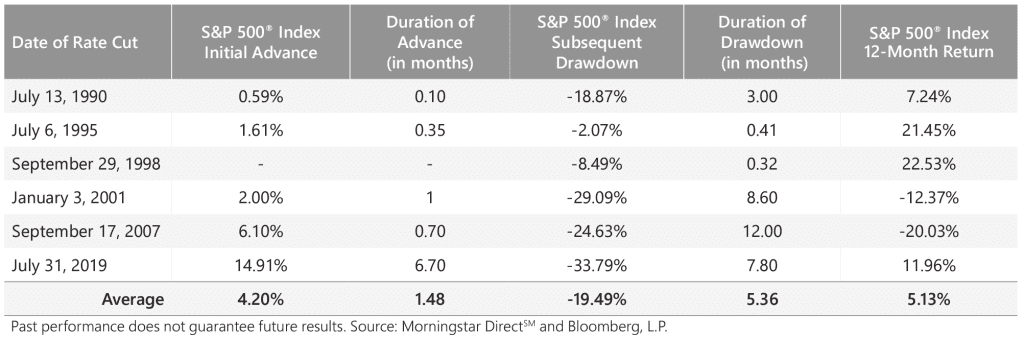
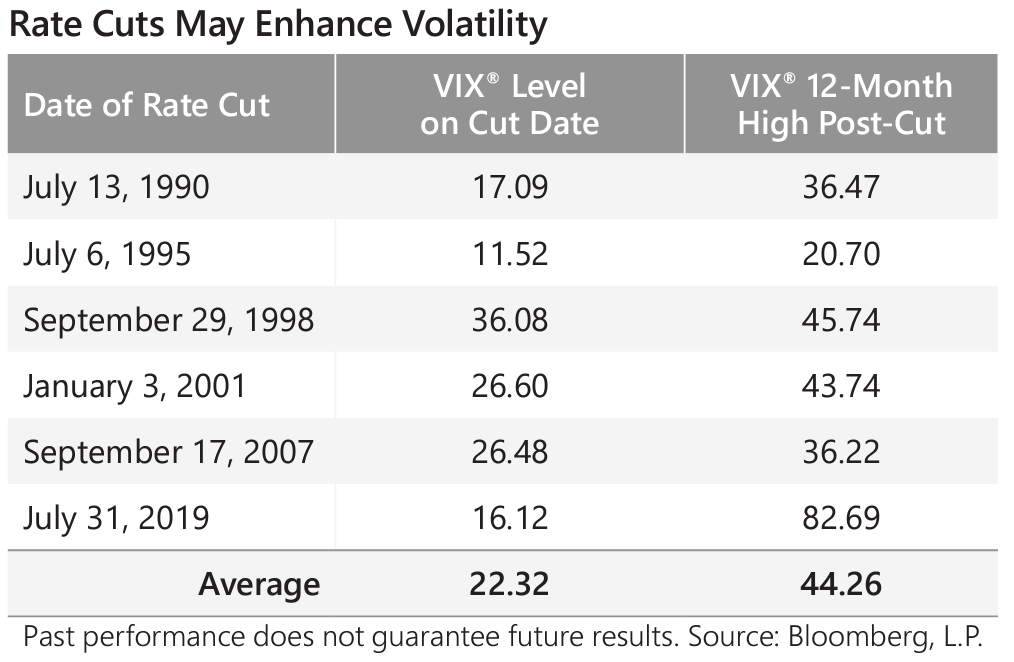 Since 1990, data shows that the equity market has experienced an average drawdown of -19.49% following a reduction in interest rates. The average drawdown duration was more than five months, but the range of duration was less than a week to twelve months. Also important to note is that in the 12 months following a rate cut, the average high closing level for the VIX® was 44.26, nearly double its level on the date of the rate cut.
So, is it the rate reduction or the lagging effects of the preceding monetary tightening period that triggers volatility to climb? Some market observations point to the latter, a lagged relationship between an increase in interest rates and implied volatility.
Once the Fed begins raising interest rates, a look at the data suggests substantial and sustained increases in volatility approximately two years after interest rates were increased. Two years after an interest rate cut, when the starting point is 3% or higher, the VIX® averages 22.05. This compares to an average of 17.59 two years after a cut, when the starting point is less than 3%. The Fed began its recent bout of rate increases in late 2022.